Learn Crypto with GTECH TV (CryptoWorld)
- We will learn about Technical Analysis and Fundamental Analysis
Crypto VS Fiat Currency

Difference Between Cryptocurrency and Fiat Currency
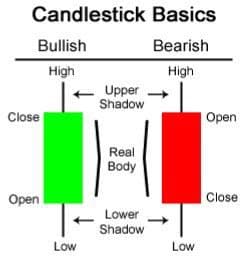
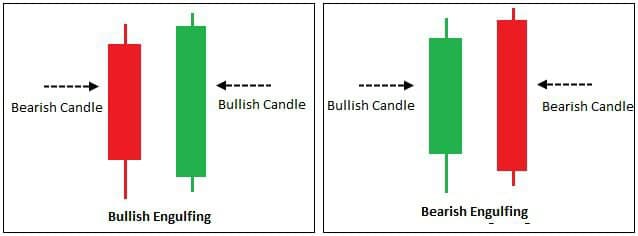
Candlestick Basics:
Marubozu Candlestick Patterns
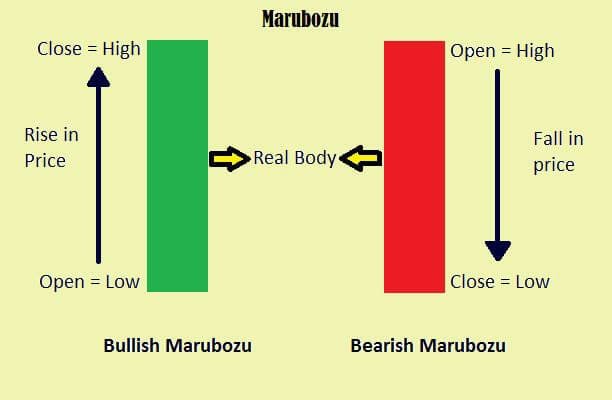
Above Picture Shows How Bullish And Bearish Marubozu Looks Like
- In A Busllish Marubozu, The Buyers Maintained Control Of The Price Throughout The Day, From The Opening Bell To The Close.
- In A Bearish Marubozu, The Sellers Controlled The Price From The Opening Bell To The Close.
Tweezer Candlestick Pattern
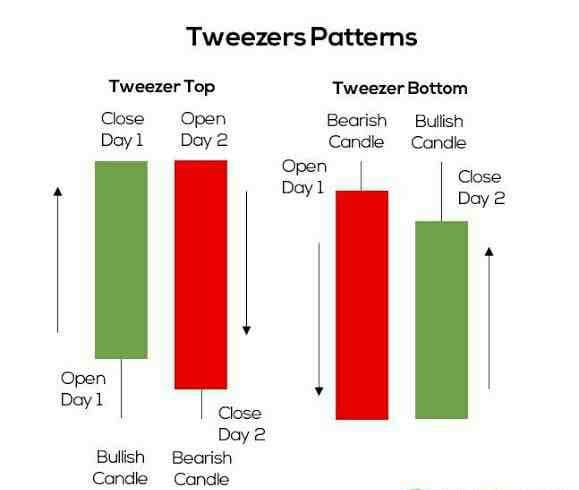
Above Picture Shows How Tweezer Candlestick Pattern Looks Like
- Tweezer Candlestick Patterns Are Two Candlestick Trend Reversal Pattern.
- Tweezer Top Indicates A Bearish Reversal Whereas Tweezer Bottom Indicates A Bullish Reversal.
Harami Candlestick Patterns
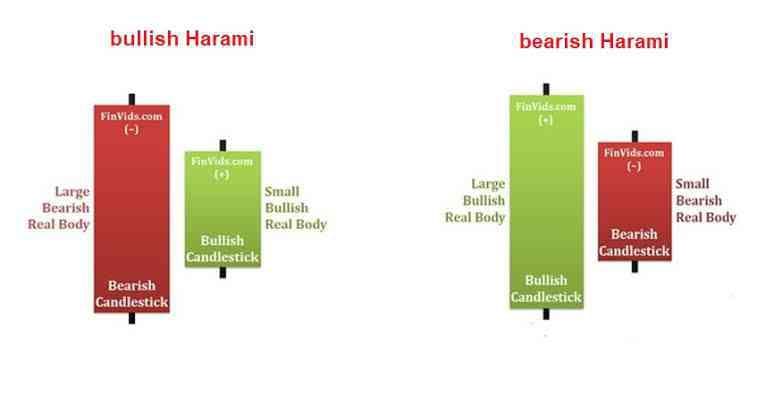
Above Picture Shows How Harami Candlestick Pattern Looks Like
- A Bullish Harami Is A CandleStick Chart Indicator For Reversal In A Bear Price Movement. It Is Generally Indicated By A Small Increase In Price (Signified By A Green Candle) That Can be Contained Within The Given Equity’s Downward Price Movement (Signified By Red Candles) From The Past Couple Of Days.
- Bearish Harami Is A Bearish Reversal Pattern. It Is Characterized By A Large Green Candle, Followed By A Small Red Candle. The Red Candle Is Contained Completely Within The Previous Green Candle. The Pattern Appears In An Uptrend.
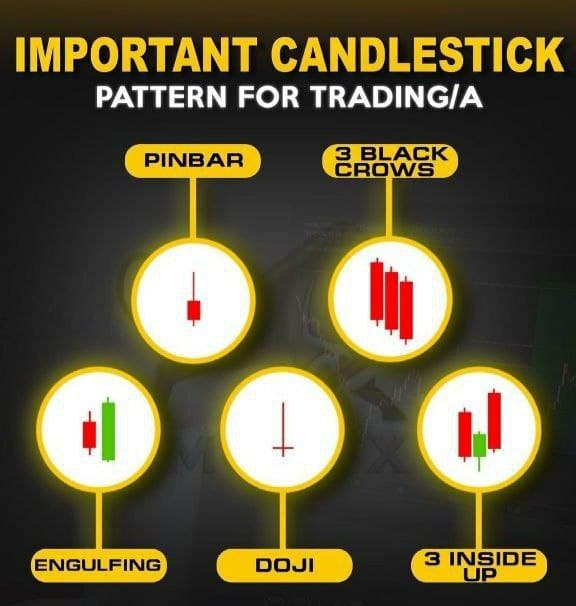
Important Candlestick Pattern for Trading
Ranks of Bitcoin Holders
